Akron · Web Monitoring
A web application for structural monitoring of major works.
Akron installs and manages structural monitoring systems on major works. The application centralises their management: sensors, readings, charts and alarms.
- Client
- Akron
- Sector
- Structural monitoring of major works
- Year
- 2025–present
- Our role
- Development of the web application
- Platform
- Web application, for desktop workstations
- Tools
- Nuxt, Django, Postgres
The projects
Projects, works and instrumentation.
The application is organised on three levels: projects, works and instrumentation.
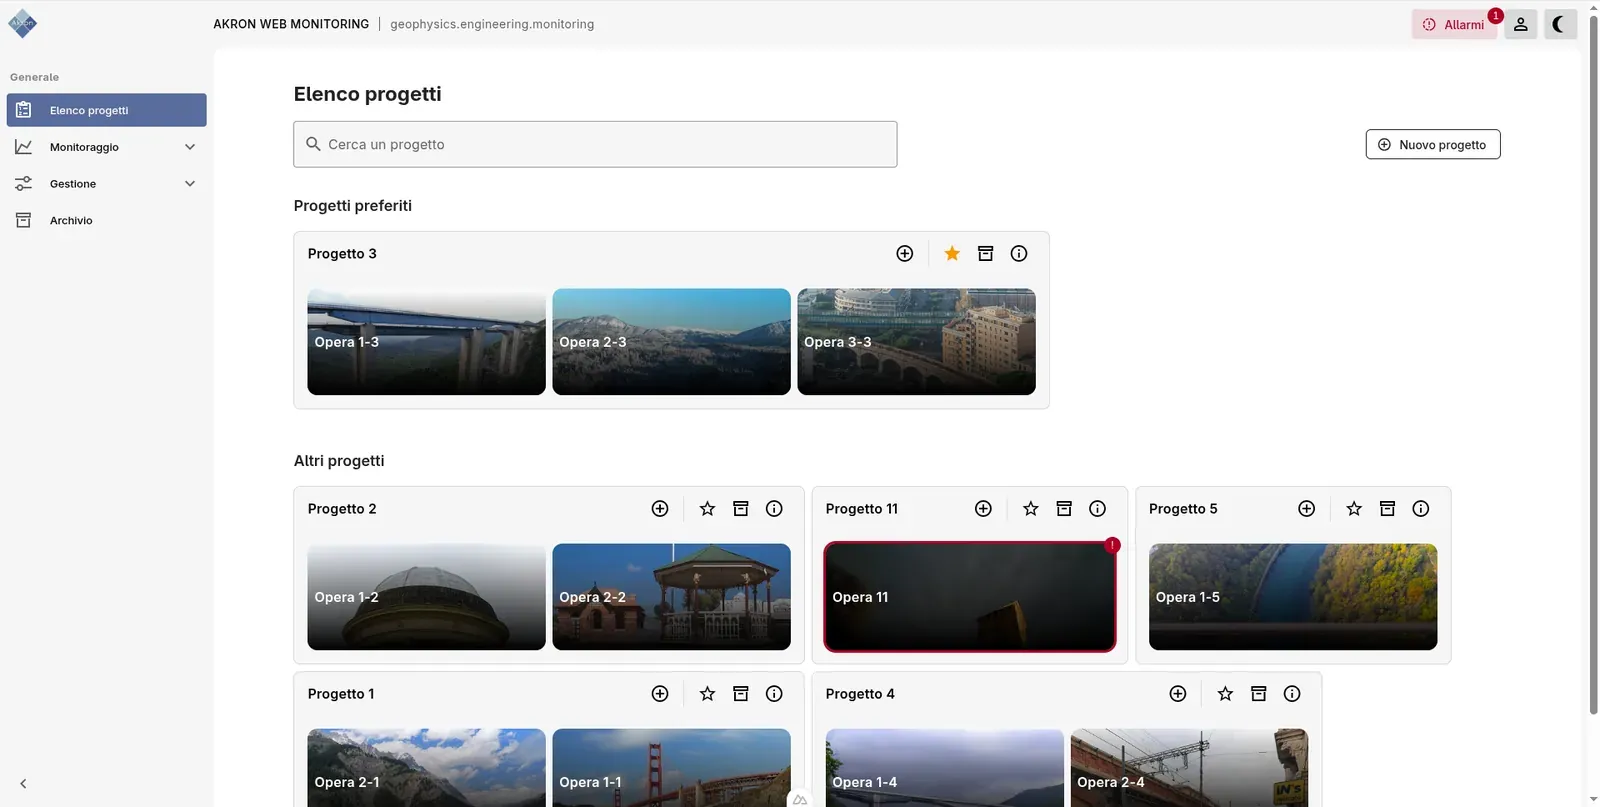
Project listThe relationship between works and projects is laid out intuitively on the home page, with direct access to the main management actions.
The instrumentation
Instrumentation and charts in a hierarchical structure.
Instrumentation and charts share the same tree component, designed for quickly browsing and searching even very large structures.
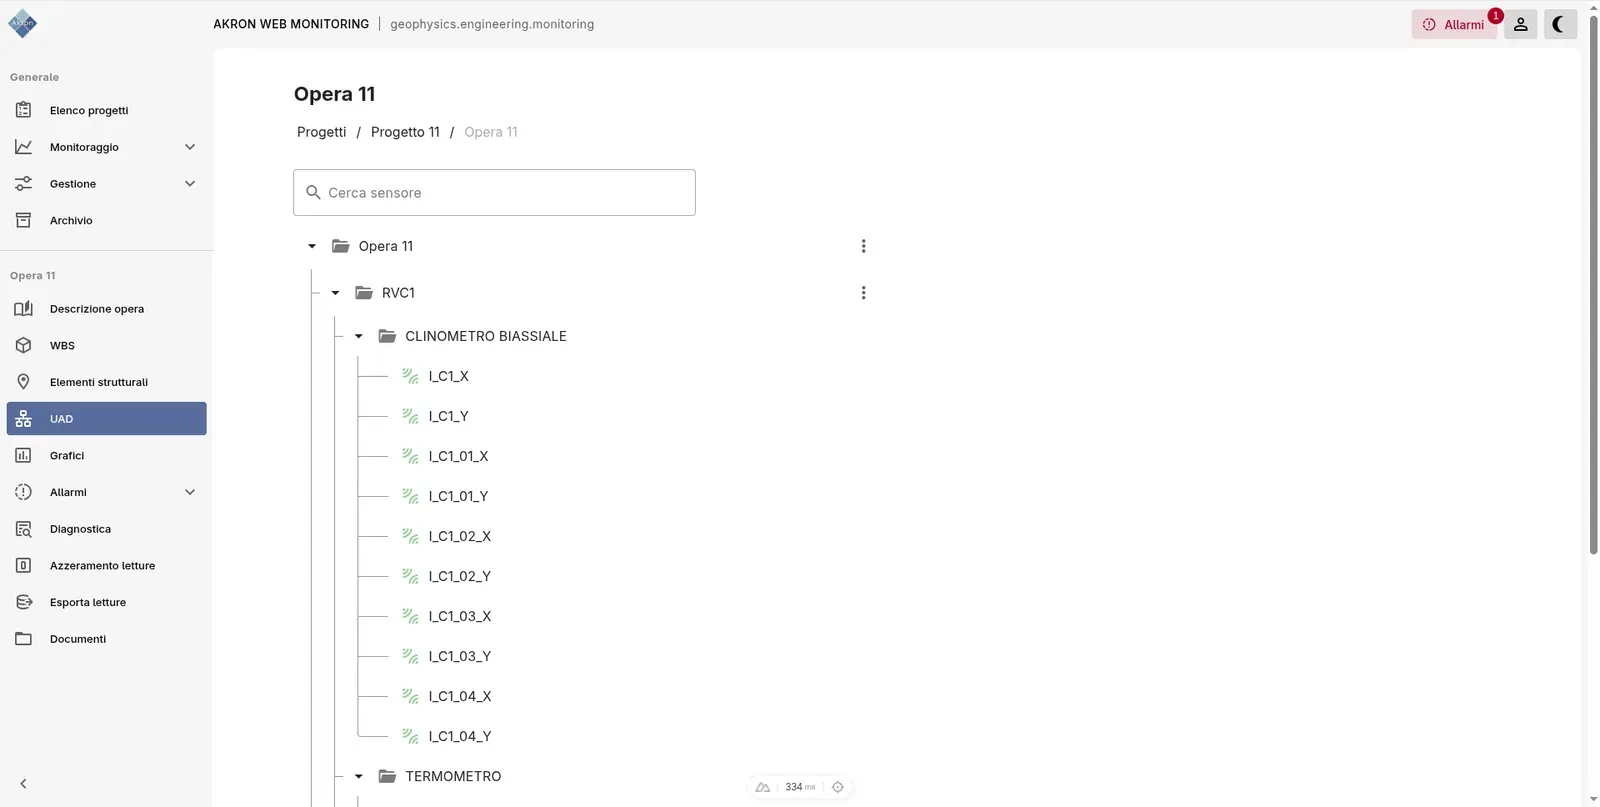
InstrumentationThe work's sensors, organised by level, with the acquisition status of each.
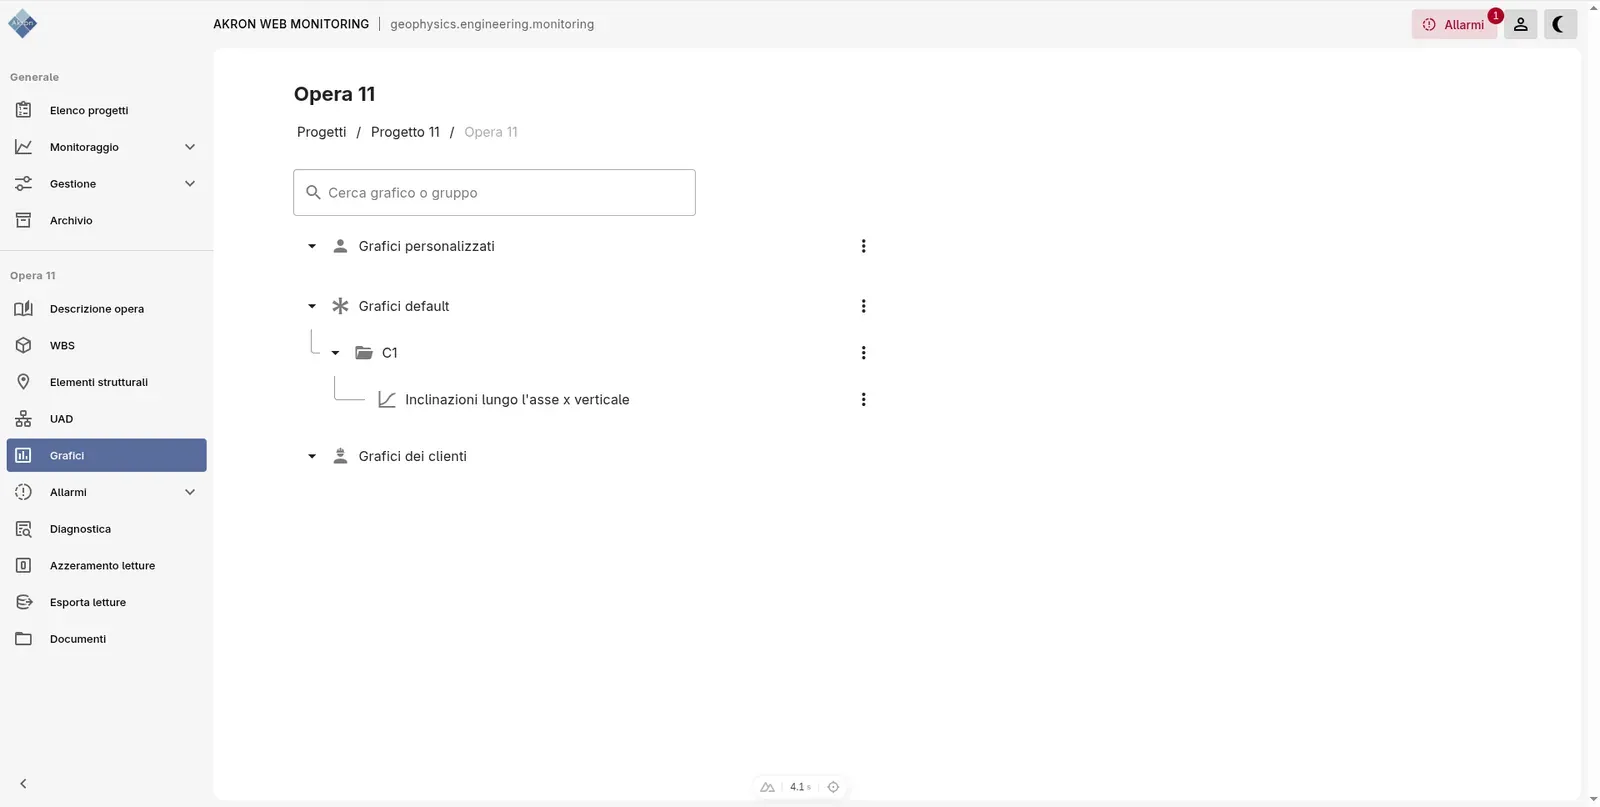
ChartsThe work's charts, split into default, custom and client-facing.
The readings
Selecting the data and configuring the chart.
A chart is built in two stages: selecting the data and configuring how it is displayed.
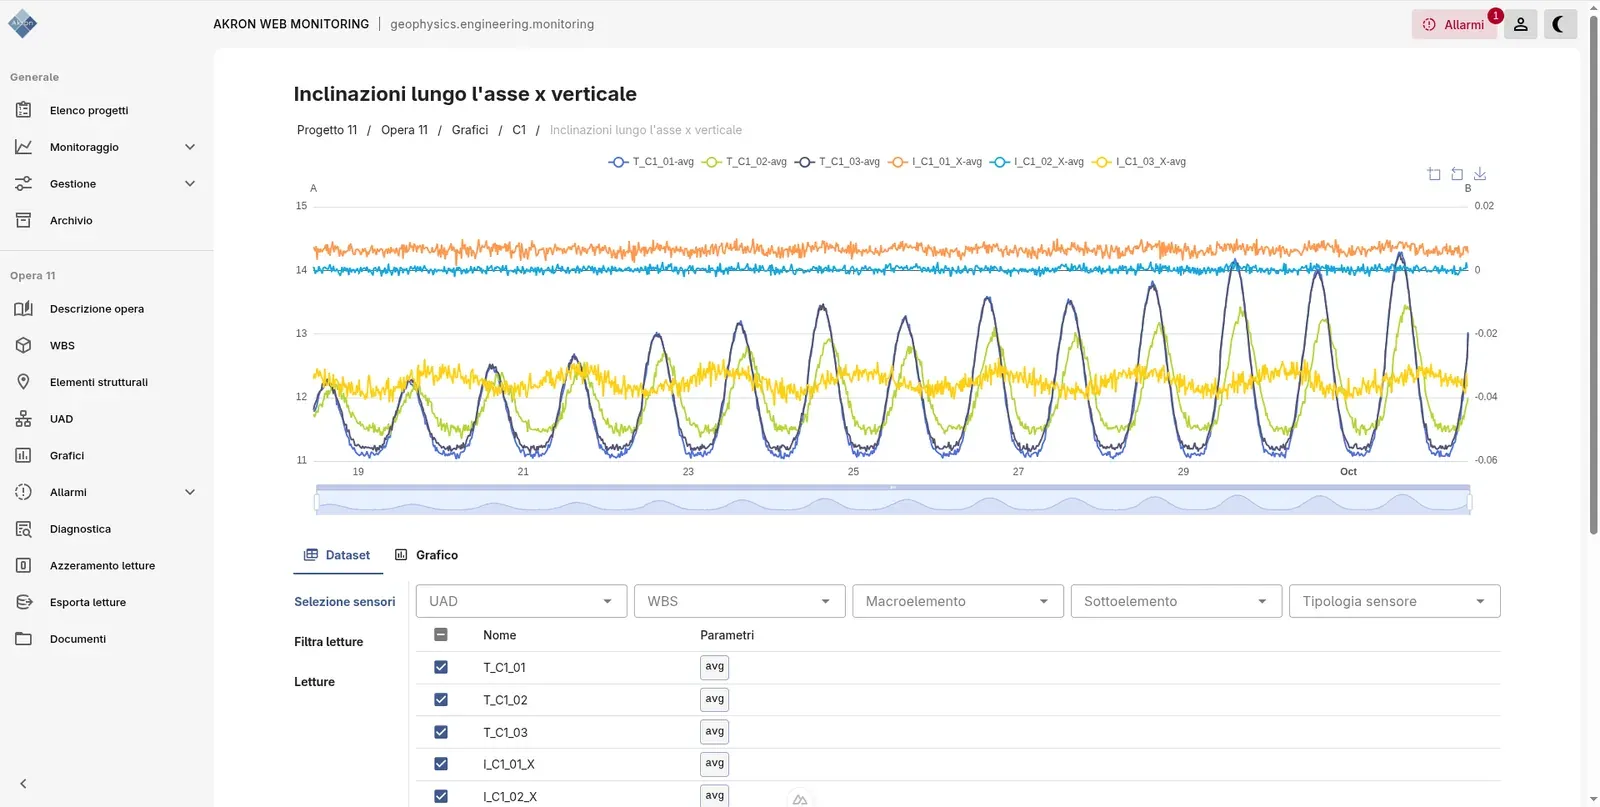
Dataset tabProgressive filters narrow down the list of sensors and set the time range of the readings.
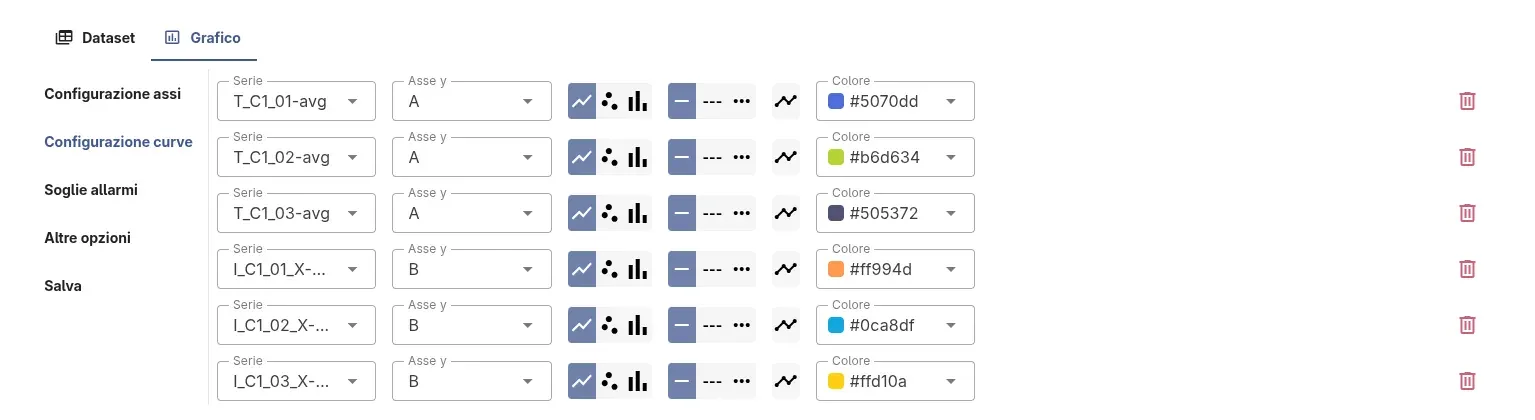
Chart tabEach curve can be configured in its rendering and reference axis, so different quantities can be compared in the same chart. The same tab manages axes and alarm thresholds.