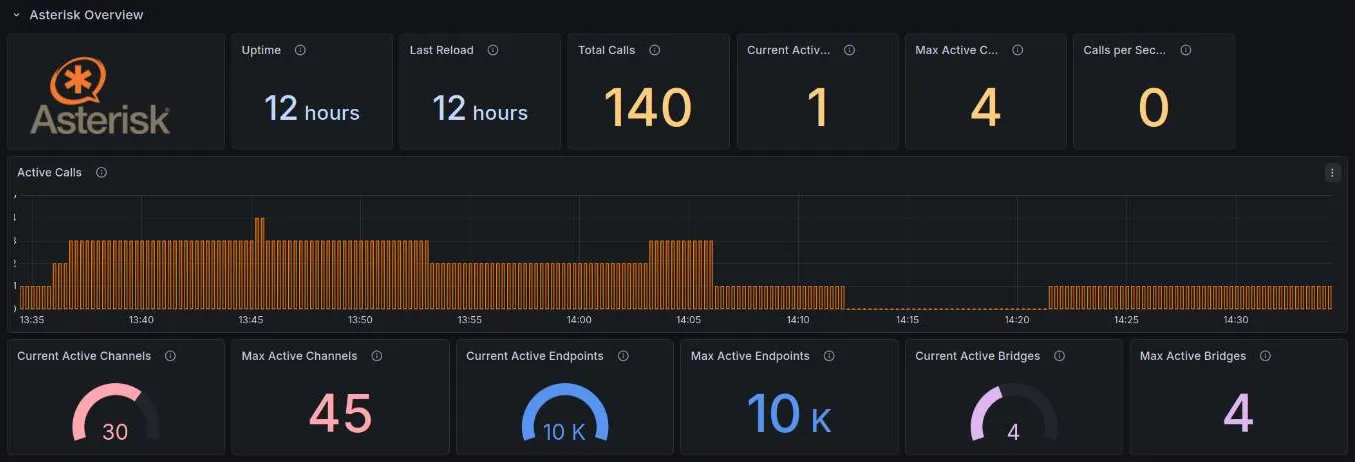
Asterisk has exported metrics in Prometheus format since version 17.0.0. In this post we take a quick look at which metrics it exports and how to set up a Prometheus job to scrape them.
Setup: Asterisk and Prometheus in Docker
Let's set up a minimal project:
asterisk-prometheus/├── compose.yaml├── asterisk/│ ├── http.conf│ └── prometheus.conf└── prometheus/ └── prometheus.ymlDocker Compose
Asterisk has no official Docker image. For our demo we use the excellent andrius/asterisk, which publishes Asterisk builds on several distributions. Not every tag includes res_prometheus, so we use the 22.11.0_debian-trixie tag (Asterisk 22 LTS on Debian 13).
services: asterisk: image: andrius/asterisk:22.11.0_debian-trixie volumes: - ./asterisk/http.conf:/etc/asterisk/http.conf:ro - ./asterisk/prometheus.conf:/etc/asterisk/prometheus.conf:ro ports: - "8088:8088" prometheus: image: prom/prometheus:v3.13.4 volumes: - ./prometheus/prometheus.yml:/etc/prometheus/prometheus.yml:ro ports: - "9090:9090" depends_on: - asteriskConfiguring Asterisk
Asterisk exposes its metrics through its built-in HTTP server, which is disabled by default. To turn it on, change a few lines in http.conf:
[general]enabled = yesbindaddr = 0.0.0.0bindport = 8088To turn on the Asterisk exporter, edit prometheus.conf instead:
[general]enabled = yesuri = metrics; core_metrics_enabled = yesuri is the path the metrics are served on, in our case http://<host>:8088/metrics. With core_metrics_enabled you also get some metrics about the process itself: uptime, time since the last reload…
Configuring Prometheus
The Prometheus config needs a job that points at the container:
global: scrape_interval: 15sscrape_configs: - job_name: asterisk static_configs: - targets: ["asterisk:8088"]Checking the result
To start the stack:
$ docker compose up -dTo read the metrics live:
$ curl -s localhost:8088/metricsasterisk_channels_count{eid="82:57:d5:8c:07:a7"} 0asterisk_calls_sum{eid="82:57:d5:8c:07:a7"} 0asterisk_calls_count{eid="82:57:d5:8c:07:a7"} 0asterisk_endpoints_count{eid="82:57:d5:8c:07:a7"} 0asterisk_bridges_count{eid="82:57:d5:8c:07:a7"} 0asterisk_core_properties{eid="82:57:d5:8c:07:a7",version="22.11.0",...} 1asterisk_core_uptime_seconds{eid="82:57:d5:8c:07:a7"} 2asterisk_core_last_reload_seconds{eid="82:57:d5:8c:07:a7"} 2asterisk_core_scrape_time_ms{eid="82:57:d5:8c:07:a7"} 0...At http://localhost:9090/targets the asterisk job should show as UP.